
Remember that record Powerball lottery jackpot of $1.6 billion? If you had won it, how quickly do you think you could spend all that money? For that price you could buy the Chicago Cubs baseball team, the Solomon Islands or a round trip to the moon – and have a little left over. But for most reasonable people, even a lifetime of spending on the most luxurious expenditures may never exhaust that sum, nor the $1.2 billion after-tax total.
Not so for our federal government. According to numbers crunched by the Mercatus Center (George Mason University,) the government spends the equivalent of that entire jackpot in less than four hours. And it would take about an hour for the government to spend the after-tax winnings.
That’s right. The Mercatus Center calculates the federal government spent $3.7 trillion in 2015 – that is, $3,700 billion or, more than $10 billion per day.
This chart shows how the daily federal spending spree makes that giant Powerball jackpot look like chump change:

It is important to remember this money does not come from lottery winnings. Instead, this windfall lands in government coffers from our tax dollars.
While tax dollars keep many vital functions of government operating such as infrastructure (roads and bridges,) public safety and defense, much more of our money goes toward interest on debt. Currently, the United States is $14 trillion in publicly held debt. Treasury securities held by federal trust funds and other government accounts bring the total U.S.debt to $19 trillion.
The debt keeps piling on because our policymakers continue to raise the nation’s debt limit, meaning the government can keep borrowing money virtually unchecked to pay for massive expensed beyond the infrastructure and basic services mentioned above.
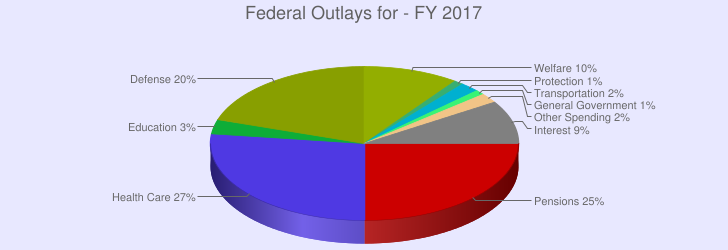
Right now there is no official debt limit in place until March of next year (2017). And the President just submitted his budget proposal for 2017, calling for $4.15 trillion on federal programs and interest, nearly five percent more than last year’s budget and more than the $3.7 trillion in 2015 spending. Here’s how the President’s proposed budget looks in a pie chart, according to usgovernmentspending.com:
 This is just a proposal. The President and Congress will spend the next several months going back and forth over which parts the government should keep in its ledger, and how much should be spent on all the programs and agencies it funds.
As our policymakers again gear up for another year of budget planning, they’d be wise to make serious spending reforms so our hard-earned tax dollars are no longer treated like lottery winnings.
For a primer on the federal budget process, read our Kitchen Table Economics lesson, “President and Congress Gearing up for Budget Battle.”
For an explanation of the different ways the federal government spends money, watch our video, “Federal Spending.”